

After more than a year of headlines talking about how home prices are going to crash, the latest data shows that price growth may be starting to pick back up again. And depending on whether you’re buying or selling, that shift means something different for you.
The Numbers May Be Starting To Turn
For the past couple of years, home price growth has been moderating – cooling from around 7% in mid-2024, according to Redfin (see graph below). But look at the right side of that graph. The pace of that growth appears to have hit its low point and started to turn.
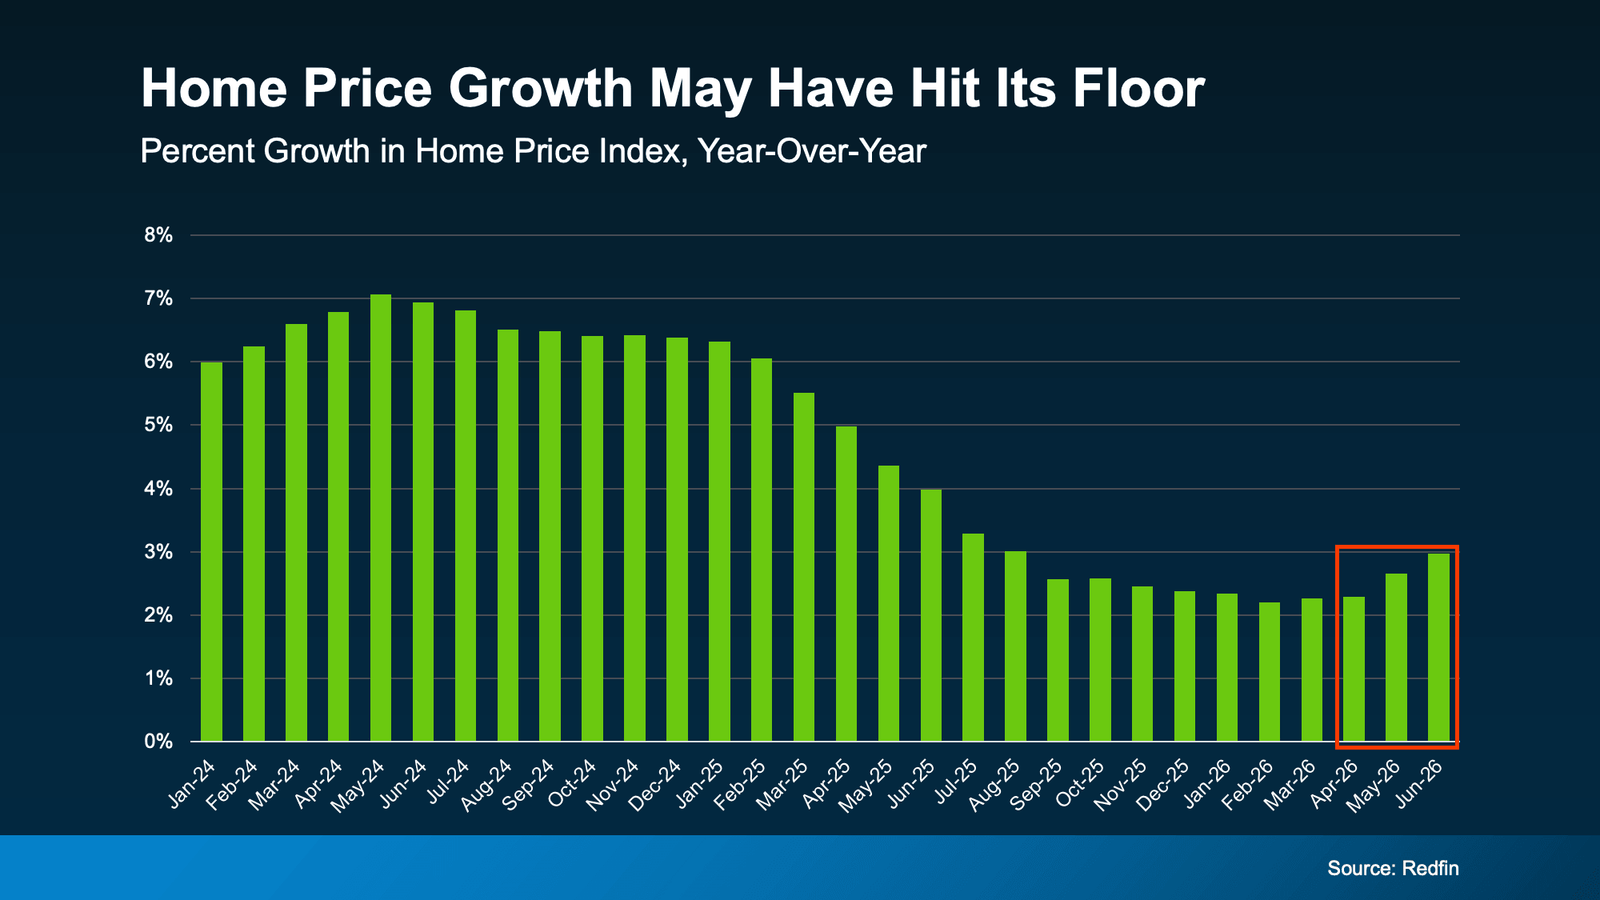
While a couple months of data doesn’t necessarily mean this will be a lasting trend, there are some other signs that this could continue.
For example, fewer markets are seeing prices decline. According to ResiClub and Zillow, about 36% of the 300 largest housing markets had falling prices as of the middle of last year. Since the start of this year, that share has been shrinking. Now? Only 23% are experiencing those mild dips (see graph below):
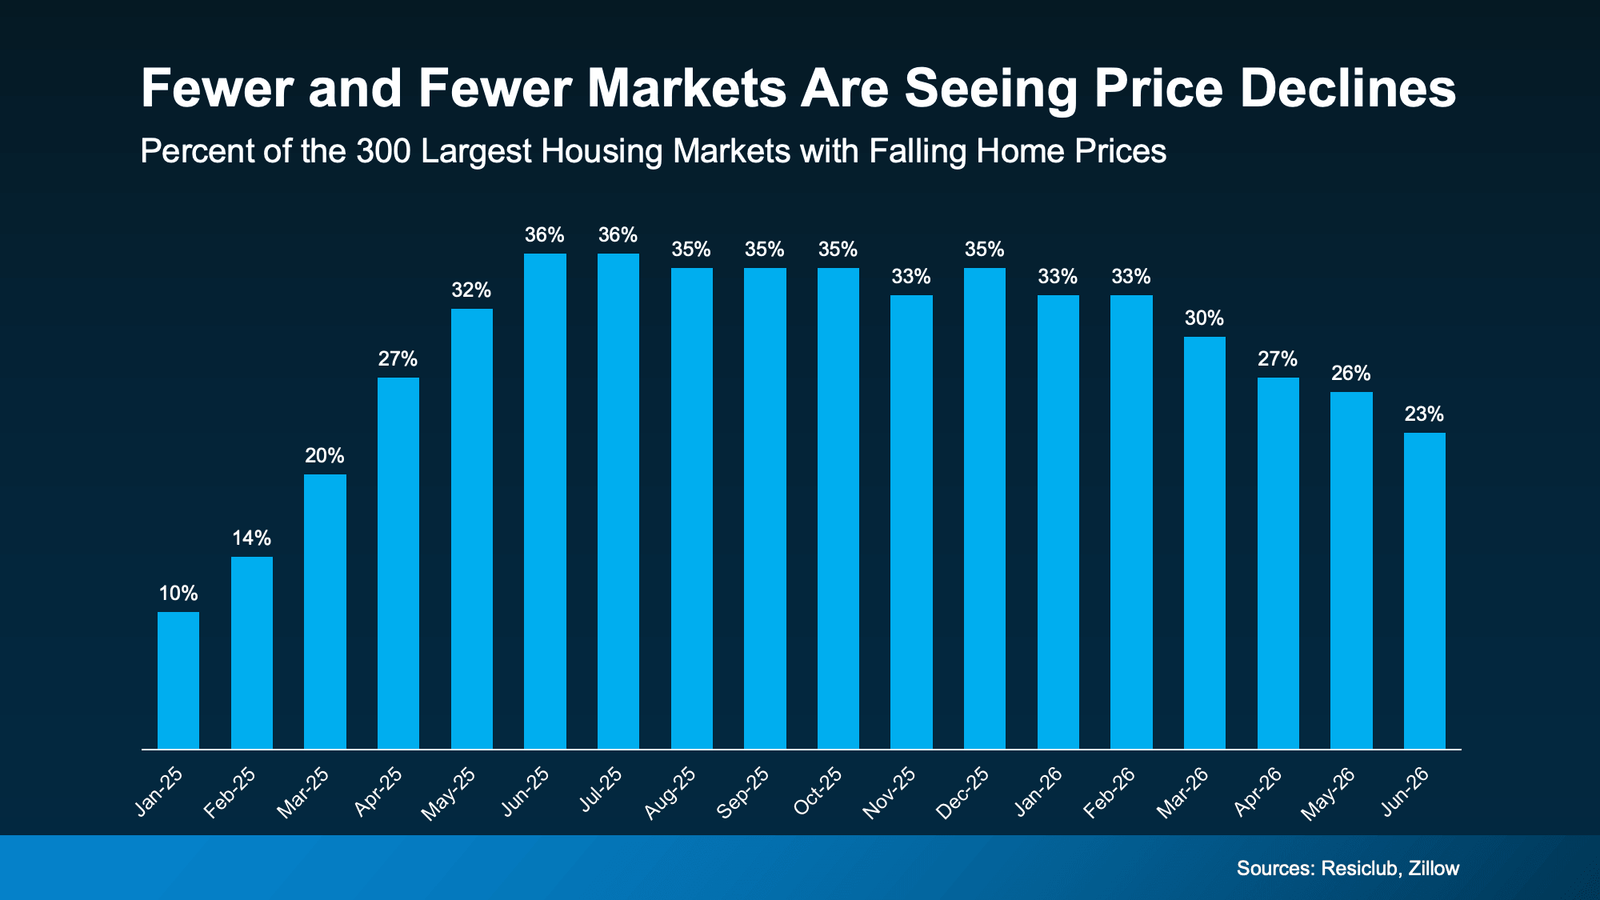
When fewer markets see prices falling, that means more markets are seeing prices rise again.
And forecasts suggest this shift has room to run. On average, experts project home prices will rise about 2.3% nationally this year. And for that to happen, price growth would have to pick up a bit in the second half of 2026.
But Remember, Real Estate Is Local
While it looks like national prices may be starting to pick back up a tiny bit, that doesn’t mean that’s what’s happening in your neighborhood.
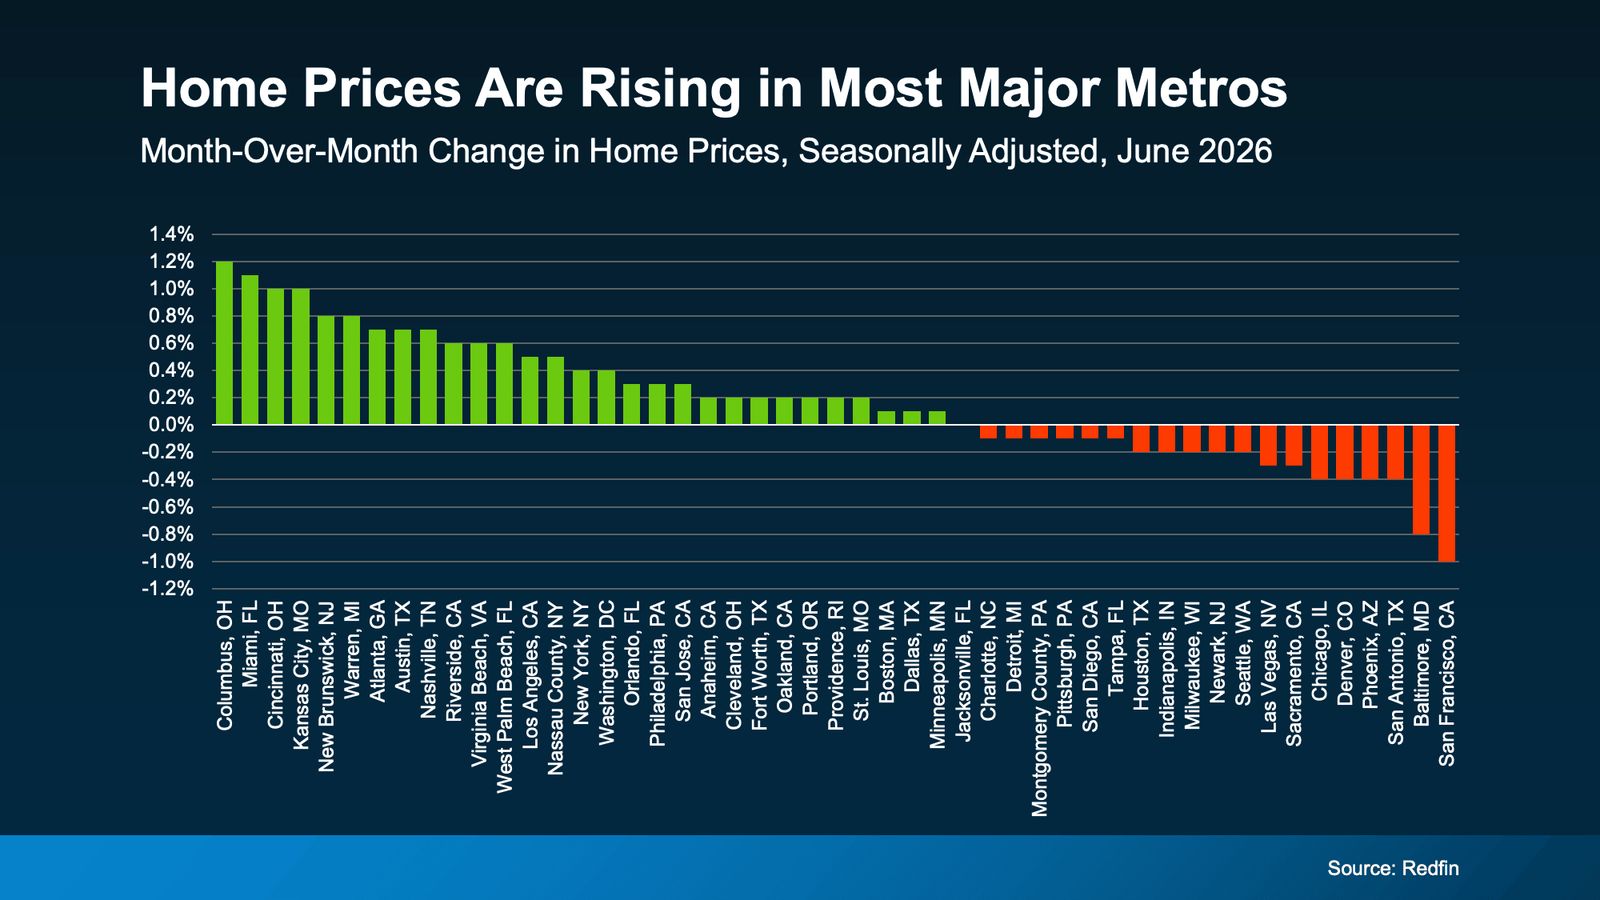
National home prices are really just an average of hundreds of local markets. Some are climbing faster. Others are still cooling. But one reason the national average may be looking up is because a growing number of metros may actually be net positive for prices this year.
Not long ago, the major metros were split about 50/50 – half seeing prices rise and half seeing them fall. Now, that balance looks like it’s starting to tip in a more positive direction. Just last month, more than half of the major metros saw prices go up, according to Redfin (see graph below):
As Selma Hepp, Chief Economist at Cotality, explains:
“. . . local markets continue to tell very different stories. Annual home price growth has changed little since the start of the year, but some markets, especially those supported by strong job and income growth in the West and more affordable Midwest markets, have seen notable acceleration in price gains.”
What This Means for You
Home price headlines can be confusing because they don’t always tell the full picture. Lean on an agent to understand what’s happening in your local market and what the early signs say for where prices may go from here.
That’s the best way to stay one step ahead of the market.
If you’re buying: slower price growth has worked in your favor. You’ve had more room to negotiate and a budget you could plan around. If price growth is picking up in your area, buying now may mean paying less than you would later this year.
If you own a home: you’ve been gaining equity all along, even while growth moderated. If growth keeps picking up, those gains could speed up, too. Lawrence Yun, Chief Economist at the National Association of Realtors (NAR), projects the typical homeowner will gain roughly $16,000 in housing wealth this year. And if you’re thinking about selling, this shift is a good early sign for you. Just remember, the market is still pretty balanced and buyer-friendly in a lot of areas right now.
Home price growth slowed way down, and now it’s showing early signs of picking back up. Whether you’re buying or selling, let’s connect so you can see exactly what prices are doing in our local market and what that means for your plans.
Bottom Line
Home price growth slowed way down, and now it’s showing early signs of picking back up. Whether you’re buying or selling, let’s connect so you can see exactly what prices are doing in our local market and what that means for your plans.


Join The Discussion