
You’ve probably heard plenty of doom and gloom about the housing market lately. High rates. Stretched budgets. Headlines that make buying or selling sound like a terrible idea. But the data tells a very different story.
This isn’t 2020 or 2021. It was never going to be. Those were the “unicorn years” – historic low mortgage rates, bidding wars on everything, homes flying off the market in days. That kind of market was a once-in-a-generation anomaly, not a baseline. So, when people compare today to that, of course it looks rough.
But compared to almost any other housing market in modern history? This one is holding up remarkably well.
Homeowners Are Sitting on a Mountain of Equity
One of the biggest reasons this market hasn’t cracked is the financial strength of the American homeowner. According to Federal Reserve data, homeowner equity and mortgage debt were nearly identical in 2008. That means, if someone hit a rough patch, they had almost nothing to fall back on. That’s what made that crash so bad.
Today? Total homeowner equity across the country sits at $35 trillion – dwarfing total mortgage debt (see graph below):
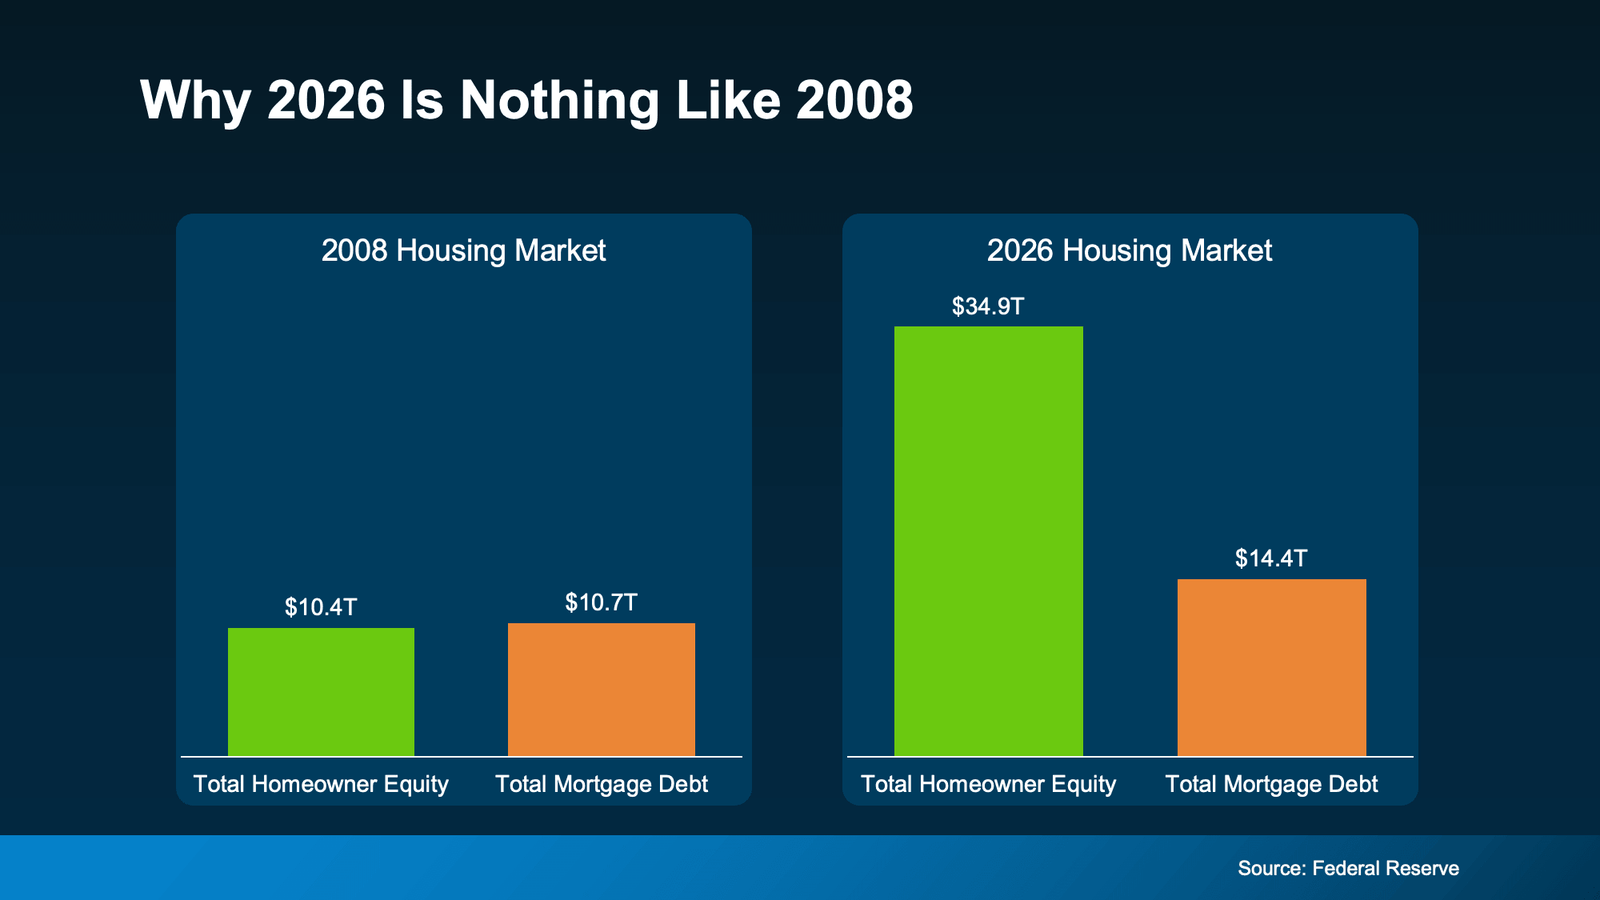
That gap means most homeowners aren’t stretched thin or one bad month away from trouble. They own a meaningful chunk of their home and that gives them options. If they needed to sell, many could because they have a cushion. And that cushion grows over time.
- Realtor.com found that homeowners who’ve been in their home just 5 years have built up around $180,000 in equity on average. Stick around 6-10 years, and that jumps to over $340,000.
- Data from ATTOM and the Census shows two-thirds of homeowners either own their home outright or have more than 50% equity.
That’s not a fragile market. That’s a population of homeowners who are financially positioned to sell, to stay, or to make their next move from a place of strength rather than pressure.
Low Rates and Low Foreclosures
At the same time, Federal Housing Finance Agency (FHFA) data shows more than half of all active mortgages still carry a rate below 4% (see graph below):
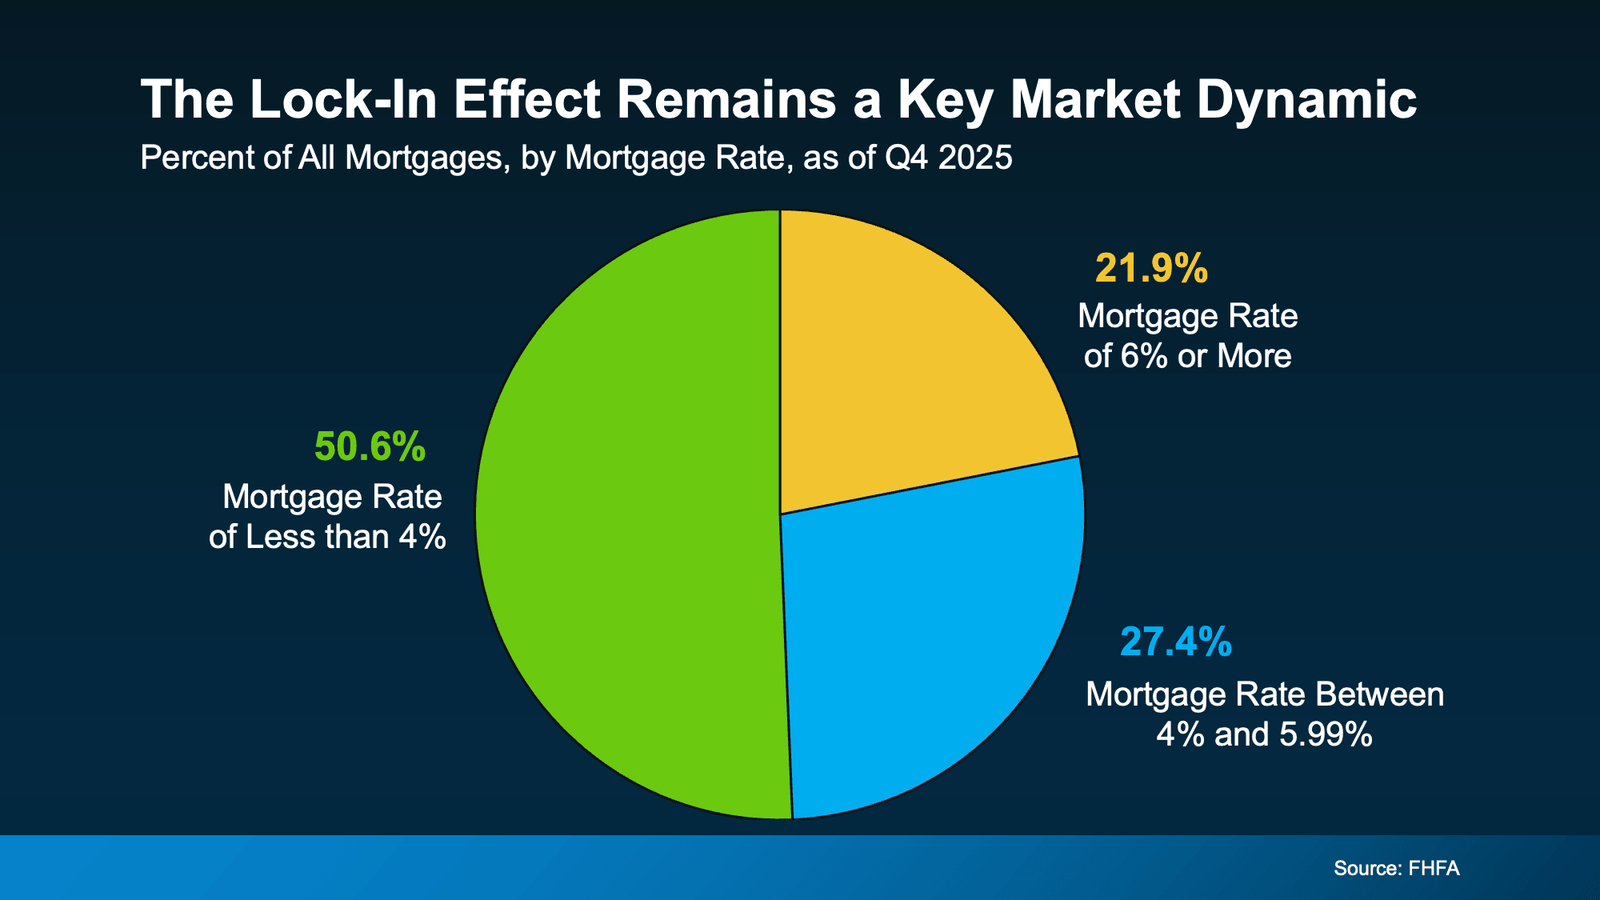
That’s a big reason inventory stays tight. Those homeowners aren’t in a rush to trade their rate for a higher one. They’re sitting comfortably in a strong financial position, not scrambling.
That comfort shows up in the foreclosure numbers, too. Despite a slight recent uptick, foreclosure volumes remain dramatically below historical norms, according to ATTOM. Homeowners aren’t losing their homes in droves. They have equity, they have breathing room, and most have options that keep them out of financial distress.
Prices Are Stabilizing, Not Crashing
Here’s another point on the resilience of the market. Redfin research shows home prices are still rising, but the pace has slowed, now closer to 2% year-over-year nationally (see graph below):
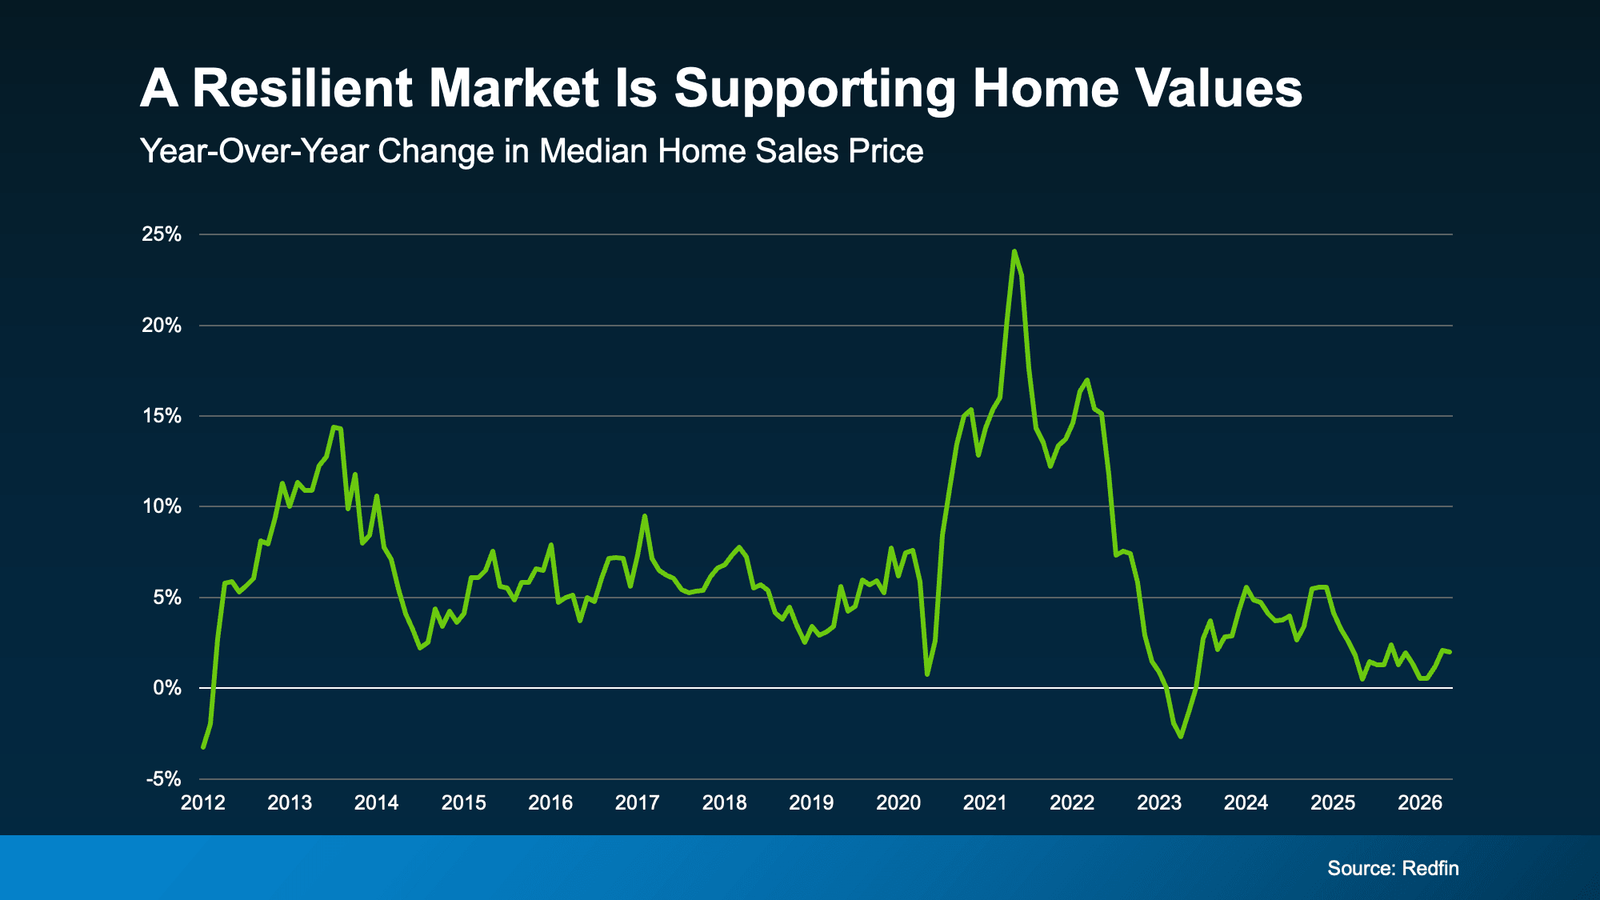
That slowdown is good news, as Daryl Fairweather, Chief Economist at Redfin, explains:
“We’re in the middle of a long-term housing market correction, not a housing market crash. After the pandemic-era frenzy sent prices soaring and inventory to historic lows, the market needed a reset.”
Bottom Line
This market isn’t broken, and waiting for a crash that isn’t coming has a cost. Every month spent on the sidelines is a month someone else is building equity, locking in a price, or getting ahead of what most experts expect to be a housing surge once broader economic conditions settle.
Whether you’re thinking about buying or selling, a local real estate agent can help you figure out what this market means for your specific situation and what your next move could look like.

Join The Discussion